資料搜尋諮詢服務
找不到您所需要的資料嗎?
我們能協助您找到最符合您研究需求的資訊
請撥打 +886-2-2799-3110
或透過電子郵件與我們聯絡 mi@hintoninfo.com
IHS_EWBIEEE xploreSTRATEGY ANALYTICSIHS_EWB_GF

頁面路徑選單

Smart Cities Market by Functional Area (Smart Governance & Smart Education, Smart Energy, Smart Infrastructure, Smart Mobility, Smart Healthcare, Smart Building, and Others): Global Opportunity Analysis and Industry Forecast, 2018 - 2025

  • LinkedIn
  • facebook
  • Twitter
出版日期:2018/11/01
頁  數:205頁
文件格式:PDF
價  格:
USD 5,370 (Single-User License)
USD 6,450 (Multi-User License)
USD 8,995 (Global-User License)
線上訂購或諮詢
 Smart Cities Market Outlook - 2025

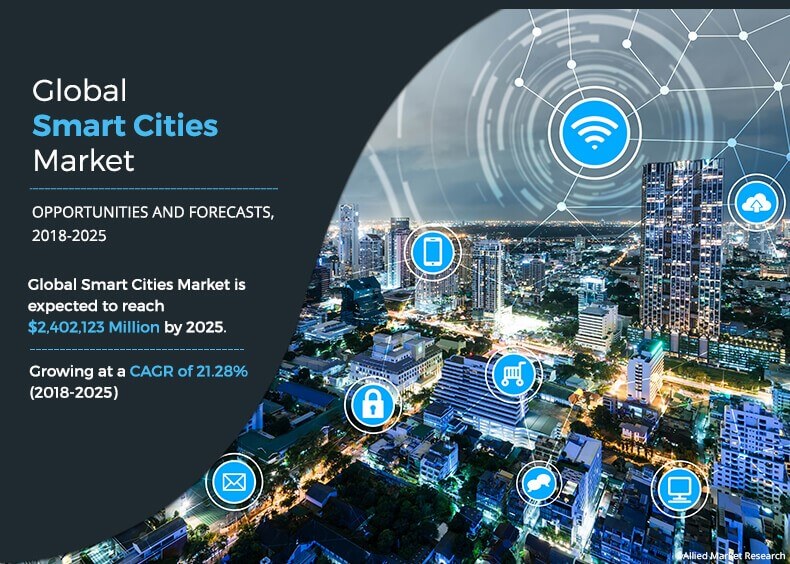
A smart city is a well-connected city that deploys various information and communication technologies to share information among public and improve the quality of government services as well as citizen welfare. This technology has been widely adopted in recent years to improve public safety which can range from monitoring areas of high crime rates to improving emergency preparedness with sensors and many more. The global smart cities market was valued at $517,629 million in 2017 and is projected to reach $2,402,123 million by 2025, registering a CAGR of 21.28% from 2018 to 2025.

Smart Cities Market

Get more information on this report: Request Sample Pages

smart cities market by functional area

Get more information on this report: Request Sample Pages

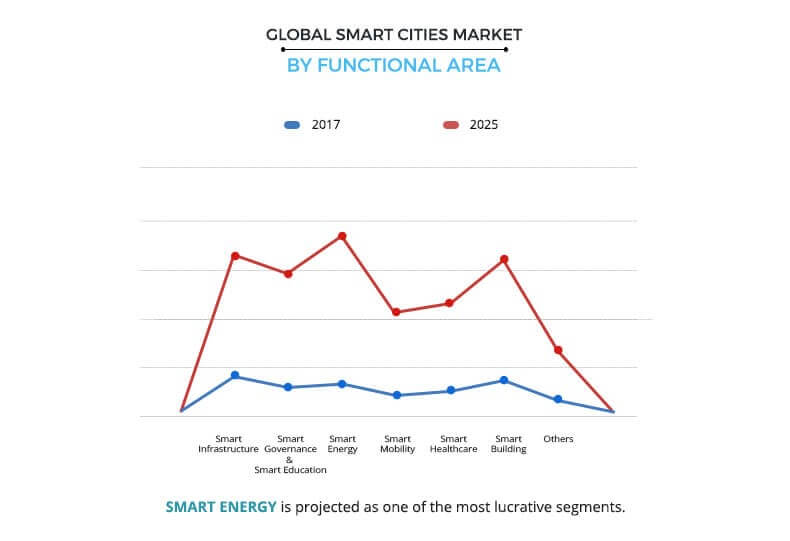
The smart infrastructure segment dominated the overall smart cities market share in 2017 due to its significant adoption of security and transportation solutions among its users. Moreover, smart energy is expected to attain the highest growth rate during the forecast period.

smart cities market by region

Get more information on this report : Request Sample Pages

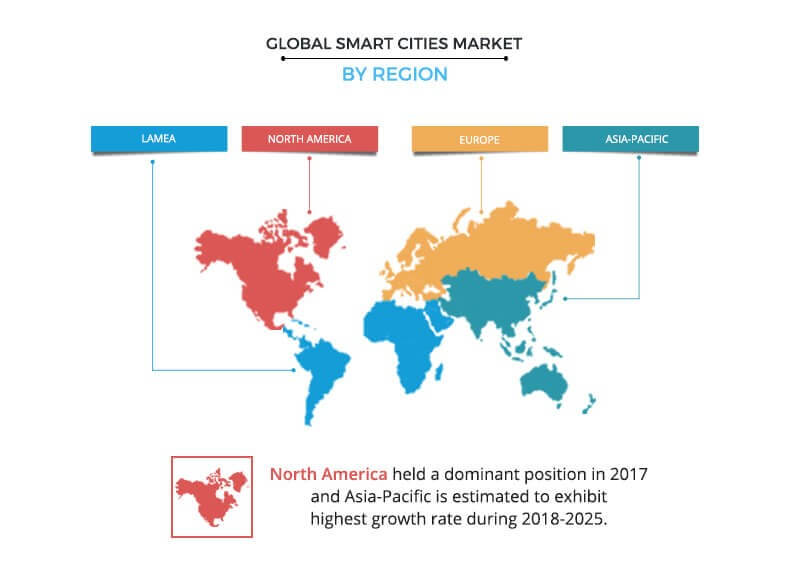
North America governed dominated the overall smart cities market in terms of revenue in 2017 due to significant adoption of smart cities solutions supported by high ICT spending among government organizations and high demand for connected solutions across the region. However, Asia-Pacific is expected to witness the highest growth rate during the forecast period due to the factor such as rise in IT spending supported by government initiatives in emerging economies such as China, Singapore, India, and South Korea.

The report focuses on drivers and restraints of the smart cities market based on the analysis of regional trends. Moreover, the study includes Porter’s five forces analysis of the industry to understand the impact of various factors such as bargaining power of suppliers, competitive intensity of competitors, threat of new entrants, threat of substitutes, and bargaining power of buyers on the smart cities market growth.

Segment review

The global smart cities market is segmented based on functional area and region. Based on functional area, it is categorized into smart governance & smart education, smart energy, smart infrastructure, smart mobility, smart healthcare, smart building, and others.

The key players operating in the global smart cities market include AT&T Inc., Cisco Systems Inc., Ericsson, General Electric, Hitachi Ltd., Huawei Technologies Co., Ltd., IBM Corporation, Intel Corporation, Microsoft Corporation, and Schneider Electric SE.

Top impacting factors

The growth of the global smart cities market is driven by proactive government smart cities initiatives, growing urbanization, and rising need of better-quality life. However, security and privacy concerns of smart cities solutions are expected to hamper the market growth during the forecast period. Moreover, rising adoption of artificial intelligence solutions among smart city projects is anticipated to provide significant growth opportunities during the forecast period.

Government smart city initiatives

Globally, governments have been playing a major role in smart cities market through its regulations and initiatives focused on deployment of smart services as a major part of their infrastructure. For instance, General Services Administration’s (GSA) Smart Buildings initiative started in May 2012 aimed to reduce costs and promote smart services modernized federal government buildings in large part through connected technologies is one such major project recorded in the recent years. Similarly, Europe smart cities market size is expected to grow at a significant rate due to its focus on energy and climate objectives. Therefore, the government is focusing on the distribution of energy with efficient models and strategies for progressing toward a low carbon future in this region. Moreover, governments in emerging economies such as China, South Korea, Dubai, India, Singapore, and Japan are aimed for smart development of their economies. The Indian government has dedicated an investment of 107.95 crores in smart cities. Further, China has announced 500 smart cities pilot projects which is again a huge investment by the government in the region. Furthermore, Dubai’s goal to achieve the objective of the Smart Dubai Plan 2021 for transforming their country into a 100% paperless government has been promoting the adoption of smart services in the country and playing a major role in the growth of the smart cities market.

Security concerns associated with smart cities

Smart cities deploy millions of sensors and smart devices in healthcare facilities, public institutions, transport services, and so forth, which tend to share a large amount of personal information on multiple devices, thus privacy and security is a major concern among the users. The significantly adopted advanced surveillance system and IP-based cameras in the system are vulnerable to several risks due to connectivity with the internet which allows the hackers to hack the system easily. Various hacking cases have been identified globally in the recent years where the data is breached and published publicly. In addition, as the resources are being distributed among various cloud clients, the privacy and security of the data is facing major threats from unethical or eavesdropper clients. This data security and privacy concern is the major factor that restrains the growth of the global smart cities market.

Emergence of artificial intelligence in smart cities

Implementation of artificial intelligence (AI) in smart city applications such as traffic and parking management, video-surveillance, safe integration of autonomous ride-share vehicles, and so forth can be of great significance. For instance, AI is already being used in CCTV cameras for facial recognition, which can be used to provide further assistance to the citizens. In case of any medical emergencies, these AI-based cameras can help in getting a help from medical professional on the scene. In addition, the facial recognition technology can also help in accessing personal information of a citizen in case of emergency. Similarly, sensors installed at parking lots and traffic signals are now using AI for accumulating useful data to plan the city initiatives among governments efficiently. Increasing number of such AI applications is expected to provide lucrative opportunities for the market growth.

Key Benefits for Smart Cities Market:

  • This study presents the analytical depiction of the global smart cities market along with the current trends and future estimations to determine the imminent investment pockets.
  • The report presents information related to key drivers, restraints, and opportunities.
  • The current smart cities market analysis for the period of 2017‐2025 highlights the financial competency of the industry.
  • Porter’s five forces analysis illustrates the potency of buyers & suppliers in the global smart cities industry.

Smart Cities Key Market Segments:

By Functional Area

  • Smart Governance & Smart Education
    • Smart Governance
    • Smart Education
  • Smart Energy
    • Power Electronics
    • Smart Energy Storage
  • Smart Infrastructure
    • Smart Transportation
    • Smart Water Management
    • Smart Stadium
    • Smart Public Safety and Security
    • Smart Lighting
    • Others
  • Smart Mobility
    • Smart Ticketing
    • Smart Parking
    • Others
  • Smart Healthcare
    • Connected Healthcare
    • Telemedicine
    • Others
  • Smart Building
    • Facility Management Systems
    • Buildings Safety and security
    • Others
  • Others

By Region

  • North America
    • U.S.
    • Canada
  • Europe
    • UK
    • Germany
    • France
    • Rest of Europe
  • Asia-Pacific
    • China
    • India
    • Japan
    • Singapore
    • Rest of Asia-Pacific
  • LAMEA
    • Latin America
    • Middle East
    • Africa

Key Market Players

  • AT&T, Inc.
  • Cisco Systems Inc.
  • Ericsson
  • General Electric
  • Hitachi Ltd.
  • Huawei Technologies Co., Ltd.
  • IBM Corporation
  • Intel Corporation
  • Microsoft Corporation
  • Schneider Electric SE
 

Chapter: 1:    INTRODUCTION

1.1.    Report description
1.2.    Key benefits for stakeholders
1.3.    Research methodology

1.3.1.    Secondary research
1.3.2.    Primary research
1.3.3.    Analyst tools & models

Chapter: 2:    EXECUTIVE SUMMARY

2.1.    CXO perspective

Chapter: 3:    MARKET OVERVIEW

3.1.    Market definition and scope
3.2.    Key findings

3.2.1.    Top impacting factors
3.2.2.    Top investment pockets
3.2.3.    Top winning strategies

3.3.    Porter's five forces analysis
3.4.    Market dynamics

3.4.1.    Drivers

3.4.1.1.    Government smart city initiatives
3.4.1.2.    Rise in need of better natural resource management
3.4.1.3.    Growth in need of public safety and security

3.4.2.    Restraints

3.4.2.1.    Security concerns associated with smart cities
3.4.2.2.    Lack of funding and adequate infrastructure

3.4.3.    Opportunities

3.4.3.1.    Emergence of artificial intelligence in smart cities
3.4.3.2.    Rise in IoT market and its application in smart cities

3.5.    Key player positioning, 2017

Chapter: 4:    SMART CITIES MARKET, BY FUNCTIONAL AREA

4.1.    Overview
4.2.    Smart Infrastructure

4.2.1.    Key market trends, growth factors, and opportunities
4.2.2.    Market size and forecast, by region
4.2.3.    Market analysis by country
4.2.4.    Smart Infrastructure, by functional area

4.2.4.1.    Smart Transportation
4.2.4.2.    Smart Water Management
4.2.4.3.    Smart Stadium
4.2.4.4.    Smart Public Safety and Security
4.2.4.5.    Smart Lighting
4.2.4.6.    Others
4.2.4.7.    Smart Infrastructure market size and forecast, by functional area

4.3.    Smart governance and smart education

4.3.1.    Key market trends, growth factors, and opportunities
4.3.2.    Market size and forecast, by region
4.3.3.    Market analysis by country
4.3.4.    Smart governance and smart education, by functional area

4.3.4.1.    Smart Governance
4.3.4.2.    Smart Education
4.3.4.3.    Smart governance and smart education market size and forecast, by functional area

4.4.    Smart energy

4.4.1.    Key market trends, growth factors, and opportunities
4.4.2.    Market size and forecast, by region
4.4.3.    Market analysis by country
4.4.4.    Smart energy, by functional area

4.4.4.1.    Smart Grid
4.4.4.2.    Power Electronics
4.4.4.3.    Smart Energy Storage
4.4.4.4.    Smart energy market size and forecast, by functional area

4.5.    Smart mobility

4.5.1.    Key market trends, growth factors, and opportunities
4.5.2.    Market size and forecast, by region
4.5.3.    Market analysis by country
4.5.4.    Smart mobility, by functional area

4.5.4.1.    Smart Ticketing
4.5.4.2.    Smart Parking
4.5.4.3.    Others
4.5.4.4.    Smart mobility market size and forecast, by functional area

4.6.    Smart healthcare

4.6.1.    Key market trends, growth factors, and opportunities
4.6.2.    Market size and forecast, by region
4.6.3.    Market analysis by country
4.6.4.    Smart healthcare, by functional area

4.6.4.1.    Connected Healthcare
4.6.4.2.    Telemedicine
4.6.4.3.    Others
4.6.4.4.    Smart healthcare market size and forecast, by functional area

4.7.    Smart buildings

4.7.1.    Key market trends, growth factors, and opportunities
4.7.2.    Market size and forecast, by region
4.7.3.    Market analysis by country
4.7.4.    Smart buildings, by functional area

4.7.4.1.    Facility Management Systems
4.7.4.2.    Buildings Safety and security
4.7.4.3.    Others
4.7.4.4.    Smart buildings market size and forecast, by functional area

4.8.    Others

4.8.1.    Key market trends, growth factors, and opportunities
4.8.2.    Market size and forecast, by region
4.8.3.    Market analysis by country

Chapter: 5:    SMART CITIES MARKET, BY REGION

5.1.    Overview
5.2.    North America

5.2.1.    Key market trends, growth factors, and opportunities
5.2.2.    Market size and forecast

5.2.2.1.    Market size and forecast, by functional area
5.2.2.2.    Market size and forecast, by country
5.2.2.3.    U.S.

5.2.2.3.1.    Market size and forecast, by functional area

5.2.2.4.    Canada

5.2.2.4.1.    Market size and forecast, by functional area

5.3.    Europe

5.3.1.    Key market trends, growth factors, and opportunities
5.3.2.    Market size and forecast

5.3.2.1.    Market size and forecast, by functional area
5.3.2.2.    Market size and forecast, by country

5.3.2.3.    UK

5.3.2.3.1.    Market size and forecast, by functional area

5.3.2.4.    Germany

5.3.2.4.1.    Market size and forecast, by functional area

5.3.2.5.    France

5.3.2.5.1.    Market size and forecast, by functional area

5.3.2.6.    Italy

5.3.2.6.1.    Market size and forecast, by functional area

5.3.2.7.    Spain

5.3.2.7.1.    Market size and forecast, by functional area

5.3.2.8.    Rest of Europe

5.3.2.8.1.    Market size and forecast, by functional area

5.4.    Asia-Pacific

5.4.1.    Key market trends, growth factors, and opportunities
5.4.2.    Market size and forecast

5.4.2.1.    Market size and forecast, by functional area
5.4.2.2.    Market size and forecast, by country
5.4.2.3.    China

5.4.2.3.1.    Market size and forecast, by functional area

5.4.2.4.    Korea

5.4.2.4.1.    Market size and forecast, by functional area

5.4.2.5.    Japan

5.4.2.5.1.    Market size and forecast, by functional area

5.4.2.6.    Singapore

5.4.2.6.1.    Market size and forecast, by functional area

5.4.2.7.    Rest of Asia-Pacific

5.4.2.7.1.    Market size and forecast, by functional area

5.5.    LAMEA

5.5.1.    Key market trends, growth factors, and opportunities
5.5.2.    Market size and forecast

5.5.2.1.    Market size and forecast, by functional area
5.5.2.2.    Market size and forecast, by country
5.5.2.3.    Latin America

5.5.2.3.1.    Market size and forecast, by functional area

5.5.2.4.    Middle East

5.5.2.4.1.    Market size and forecast, by functional area

5.5.2.5.    Africa

5.5.2.5.1.    Market size and forecast, by functional area

Chapter: 6:    COMPANY PROFILES

6.1.    AT&T INC.

6.1.1.    Company overview
6.1.2.    Company snapshot
6.1.3.    Operating business segments
6.1.4.    Product portfolio
6.1.5.    Business performance
6.1.6.    Key strategic moves and developments

6.2.    CISCO SYSTEMS, INC.

6.2.1.    Company overview
6.2.2.    Company snapshot
6.2.3.    Operating business segments
6.2.4.    Product portfolio
6.2.5.    Business performance
6.2.6.    Key strategic moves and developments

6.3.    ERICSSON

6.3.1.    Company overview
6.3.2.    Company snapshot
6.3.3.    Operating business segments
6.3.4.    Product portfolio
6.3.5.    Business performance
6.3.6.    Key strategic moves and developments

6.4.    GENERAL ELECTRIC

6.4.1.    Company overview
6.4.2.    Company snapshot
6.4.3.    Operating business segments
6.4.4.    Product portfolio
6.4.5.    Business performance
6.4.6.    Key strategic moves and developments

6.5.    HITACHI, LTD.

6.5.1.    Company overview
6.5.2.    Company snapshot
6.5.3.    Operating business segments
6.5.4.    Product portfolio
6.5.5.    Business performance
6.5.6.    Key strategic moves and developments

6.6.    HUAWEI TECHNOLOGIES CO., LTD.

6.6.1.    Company overview
6.6.2.    Company snapshot
6.6.3.    Operating business segments
6.6.4.    Product portfolio
6.6.5.    Business performance
6.6.6.    Key strategic moves and developments

6.7.    IBM CORPORATION

6.7.1.    Company overview
6.7.2.    Company snapshot
6.7.3.    Operating business segments
6.7.4.    Product portfolio
6.7.5.    Business performance
6.7.6.    Key strategic moves and developments

6.8.    INTEL CORPORATION

6.8.1.    Company overview
6.8.2.    Company snapshot
6.8.3.    Operating business segments
6.8.4.    Product portfolio
6.8.5.    Business performance
6.8.6.    Key strategic moves and developments

6.9.    MICROSOFT CORPORATION

6.9.1.    Company overview
6.9.2.    Company snapshot
6.9.3.    Operating business segments
6.9.4.    Product portfolio
6.9.5.    Business performance
6.9.6.    Key strategic moves and developments

6.10.    SCHNEIDER ELECTRIC

6.10.1.    Company overview
6.10.2.    Company snapshot
6.10.3.    Operating business segments
6.10.4.    Product portfolio
6.10.5.    Business performance
6.10.6.    Key strategic moves and developments

LIST OF TABLES

TABLE 01.    GLOBAL SMART CITIES MARKET REVENUE, BY FUNCTIONAL AREA, 2017-2025 ($MILLION)
TABLE 02.    GLOBAL SMART GOVERNANCE AND SMART EDUCATION MARKET, BY REGION, 2017-2025 ($MILLION)
TABLE 03.    GLOBAL SMART ENERGY MARKET, BY REGION, 2017-2025 ($MILLION)
TABLE 04.    GLOBAL SMART INFRASTRUCTURE MARKET, BY REGION, 2017-2025 ($MILLION)
TABLE 05.    GLOBAL SMART MOBILITY MARKET, BY REGION, 2017-2025 ($MILLION)
TABLE 06.    GLOBAL SMART HEALTHCARE MARKET, BY REGION, 2017-2025 ($MILLION)
TABLE 07.    GLOBAL SMART BUILDING MARKET, BY REGION, 2017-2025 ($MILLION)
TABLE 08.    GLOBAL OTHERS SMART CITIES MARKET, BY REGION, 2017-2025 ($MILLION)
TABLE 09.    GLOBAL SMART CITIES MARKET REVENUE, BY GEOGRAPHY, 2017-2025 ($MILLION)
TABLE 10.    NORTH AMERICA SMART CITIES MARKET REVENUE, BY FUNCTIONAL AREA, 2017-2025 ($MILLION)
TABLE 11.    NORTH AMERICA SMART CITIES MARKET REVENUE, BY COUNTRY, 2017-2025 ($MILLION)
TABLE 12.    U.S. SMART CITIES MARKET REVENUE, BY FUNCTIONAL AREA,  2017-2025 ($MILLION)
TABLE 13.    CANADA SMART CITIES MARKET REVENUE, BY FUNCTIONAL AREA, 2017-2025 ($MILLION)
TABLE 14.    EUROPE SMART CITIES MARKET REVENUE, BY FUNCTIONAL AREA, 2017-2025 ($MILLION)
TABLE 15.    EUROPE SMART CITIES MARKET REVENUE, BY COUNTRY, 2017-2025 ($MILLION)
TABLE 16.    UK SMART CITIES MARKET REVENUE, BY FUNCTIONAL AREA, 2017-2025 ($MILLION)
TABLE 17.    GERMANY SMART CITIES MARKET REVENUE, BY FUNCTIONAL AREA, 2017-2025 ($MILLION)
TABLE 18.    FRANCE SMART CITIES MARKET REVENUE, BY FUNCTIONAL AREA, 2017-2025 ($MILLION)
TABLE 19.    REST OF EUROPE SMART CITIES MARKET REVENUE, BY FUNCTIONAL AREA, 2017-2025 ($MILLION)
TABLE 20.    ASIA-PACIFIC SMART CITIES MARKET REVENUE, BY FUNCTIONAL AREA, 2017-2025 ($MILLION)
TABLE 21.    ASIA-PACIFIC SMART CITIES MARKET REVENUE, BY COUNTRY, 2017-2025 ($MILLION)
TABLE 22.    CHINA SMART CITIES MARKET REVENUE, BY FUNCTIONAL AREA, 2017-2025 ($MILLION)
TABLE 23.    INDIA SMART CITIES MARKET REVENUE, BY FUNCTIONAL AREA,  2017-2025 ($MILLION)
TABLE 24.    JAPAN SMART CITIES MARKET REVENUE, BY FUNCTIONAL AREA,  2017-2025 ($MILLION)
TABLE 25.    SINGAPORE SMART CITIES MARKET REVENUE, BY FUNCTIONAL AREA,  2017-2025 ($MILLION)
TABLE 26.    REST OF ASIA-PACIFIC SMART CITIES MARKET REVENUE, BY COMPONENT, 2017-2025 ($MILLION)
TABLE 27.    REST OF ASIA-PACIFIC SMART CITIES MARKET REVENUE, BY FUNCTIONAL AREA, 2017-2025 ($MILLION)
TABLE 28.    LAMEA SMART CITIES MARKET REVENUE, BY FUNCTIONAL AREA,  2017-2025 ($MILLION)
TABLE 29.    LAMEA SMART CITIES MARKET REVENUE, BY COUNTRY, 2017-2025 ($MILLION)
TABLE 30.    LATIN AMERICA SMART CITIES MARKET REVENUE, BY FUNCTIONAL AREA, 2017-2025 ($MILLION)
TABLE 31.    MIDDLE EAST SMART CITIES MARKET REVENUE, BY FUNCTIONAL AREA, 2017-2025 ($MILLION)
TABLE 32.    AFRICA SMART CITIES MARKET REVENUE, BY FUNCTIONAL AREA,  2017-2025 ($MILLION)
TABLE 33.    AT&T: COMPANY SNAPSHOT
TABLE 34.    AT&T: PRODUCT PORTFOLIO
TABLE 35.    CISCO SYSTEMS INC.: COMPANY SNAPSHOT
TABLE 36.    CISCO SYSTEMS INC.: PRODUCT PORTFOLIO
TABLE 37.    ERICSSON: COMPANY SNAPSHOT
TABLE 38.    ERICSSON: PRODUCT PORTFOLIO
TABLE 39.    GENERAL ELECTRIC: COMPANY SNAPSHOT
TABLE 40.    GENERAL ELECTRIC PRODUCT PORTFOLIO
TABLE 41.    HITACHI LTD.: COMPANY SNAPSHOT
TABLE 42.    HITACHI LTD. : PRODUCT PORTFOLIO
TABLE 43.    HUAWEI TECHNOLOGIES CO., LTD. : COMPANY SNAPSHOT
TABLE 44.    HUAWEI TECHNOLOGIES CO., LTD. : PRODUCT PORTFOLIO
TABLE 45.    INTERNATIONAL BUSINESS MACHINES CORP. : COMPANY SNAPSHOT
TABLE 46.    INTERNATIONAL BUSINESS MACHINES CORP. : OPERATING SEGMENTS
TABLE 47.    INTERNATIONAL BUSINESS MACHINES CORP. : PRODUCT PORTFOLIO
TABLE 48.    INTEL CORPORATION: COMPANY SNAPSHOT
TABLE 49.    INTEL CORPORATION: PRODUCT PORTFOLIO
TABLE 50.    MICROSOFT CORPORATION: COMPANY SNAPSHOT
TABLE 51.    MICROSOFT CORPORATION: OPERATING SEGMENTS
TABLE 52.    MICROSOFT CORPORATION: PRODUCT PORTFOLIO
TABLE 53.    SCHNEIDER ELECTRIC SE: COMPANY SNAPSHOT
TABLE 54.    SCHNEIDER ELECTRIC SE: OPERATING SEGMENTS
TABLE 55.    SCHNEIDER ELECTRIC SE: PRODUCT PORTFOLIO

LIST OF FIGURES

FIGURE 01.    GLOBAL SMART CITIES MARKET, 2017-2025
FIGURE 02.    GLOBAL SMART CITIES MARKET, BY REGION, 2017-2025
FIGURE 03.    GLOBAL SMART CITIES MARKET: KEY PLAYERS
FIGURE 04.    SEGMENTATION OF GLOBAL SMART CITIES MARKET
FIGURE 05.    TOP INVESTMENT POCKETS: SMART CITIES MARKET
FIGURE 06.    TOP WINNING STRATEGIES, BY YEAR
FIGURE 07.    TOP WINNING STRATEGY, BY DEVELOPMENT
FIGURE 08.    TOP WINNING STRATEGY, BY COMPANY
FIGURE 09.    BARGAINING POWER OF BUYERS
FIGURE 10.    BARGAINING POWER OF SUPPLIERS
FIGURE 11.    THREAT OF NEW ENTRANTS
FIGURE 12.    THREAT OF SUBSTITUTES
FIGURE 13.    COMPETITIVE RIVALRY
FIGURE 14.    MARKET PLAYER POSITIONING: SMART CITIES MARKET
FIGURE 15.    DRIVERS, RESTRAINTS, AND OPPORTUNITIES: SMART CITIES MARKET
FIGURE 16.    U.S. SMART CITIES MARKET, 2017-2025 ($ MILLION)
FIGURE 17.    CANADA SMART CITIES MARKET, 2017-2025 ($ MILLION)
FIGURE 18.    UK SMART CITIES MARKET, 2017-2025 ($ MILLION)
FIGURE 19.    GERMANY SMART CITIES MARKET, 2017-2025 ($ MILLION)
FIGURE 20.    FRANCE SMART CITIES MARKET, 2017-2025 ($ MILLION)
FIGURE 21.    REST OF EUROPE SMART CITIES MARKET, 2017-2025 ($ MILLION)
FIGURE 22.    CHINA SMART CITIES MARKET, 2017-2025 ($ MILLION)
FIGURE 23.    INDIA SMART CITIES MARKET, 2017-2025 ($ MILLION)
FIGURE 24.    JAPAN SMART CITIES MARKET, 2017-2025 ($ MILLION)
FIGURE 25.    SINGAPORE SMART CITIES MARKET, 2017-2025 ($ MILLION)
FIGURE 26.    REST OF ASIA-PACIFIC SMART CITIES MARKET, 2017-2025 ($ MILLION)
FIGURE 27.    LATIN AMERICA SMART CITIES MARKET, 2017-2025 ($ MILLION)
FIGURE 28.    MIDDLE EAST SMART CITIES MARKET, 2017-2025 ($ MILLION)
FIGURE 29.    AFRICA SMART CITIES MARKET, 2017-2025 ($ MILLION)
FIGURE 30.    INTERNATIONAL BUSINESS MACHINES CORP.: REVENUE, 2015–2017 ($MILLION)
FIGURE 31.    INTERNATIONAL BUSINESS MACHINES CORP.: REVENUE SHARE BY SEGMENT, 2017 (%)
FIGURE 32.    INTERNATIONAL BUSINESS MACHINES CORP.: REVENUE SHARE BY GEOGRAPHY, 2017 (%)
FIGURE 33.    INTEL CORPORATION : REVENUE, 2015–2017 ($MILLION)
FIGURE 34.    MICROSOFT CORPORATION: REVENUE, 2015–2017 ($MILLION)
FIGURE 35.    MICROSOFT CORPORATION: REVENUE SHARE BY SEGMENT, 2017 (%)
FIGURE 36.    MICROSOFT CORPORATION: REVENUE SHARE BY GEOGRAPHY, 2016 (%)
FIGURE 37.    SCHNEIDER ELECTRIC SE: REVENUE, 2015–2017 ($MILLION)
FIGURE 38.    SCHNEIDER ELECTRIC SE: REVENUE SHARE BY SEGMENT, 2017 (%)
FIGURE 39.    SCHNEIDER ELECTRIC SE: REVENUE SHARE BY GEOGRAPHY, 2017 (%)

回上頁